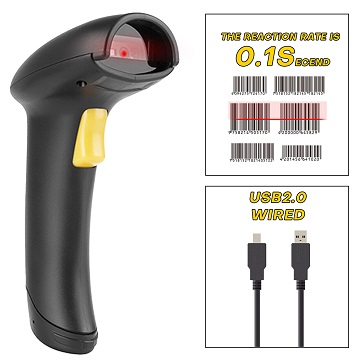
If you paid more than $12 for your barcoder you got gypped. They have plunged like modbus devices over the past ten years and can be occasionally found for as little as $2.00 secondhand. I got one from a thrift shop a while back for $1 which worked as soon as I plugged it in.
Unlike prior versions which worked off a PS2 Splitter or serial cable, no drivers are needed. You plug them into a USB port and they are instantly recognized as text input devices. I will probably retain the CueCat javascript API as an optional code snippet to load for inventory scanning.
When entering new stock into VAULT-SYS inventory you just swipe the barcoder over the food UPC and as quickly as you can scan they will start to list in a table to the right of the screen. A worker thread in the web browser then begins to try to identify them by calling back to the server with a websocket (signal-R is also supported) and will fill in their crucial data like serving portions, weight, quantity. This is an attempt to prepopulate an inventory record for you with a lot of data templated for you already set up.
I foresee this as another new development working towards usability and instant convenience when the barcode scanning screen appears in the browser, intended to make new entries in your preps and setting of all expiry, use-by and best-by dates as automated as possible. In addition I have lookup records from the FDA that may be able to autopopulate the nutritional properties of the food so you can run scans for vitamins and minerals and other critical nutritional needs. The idea is to integrate these into a dashboard so you can see things like “ADEQUATE VITAMIN C” piechart or barchart that shows you at your current burn rate computed against your personnel roster that you will run out of vitamin C within 6 months and could develop scurvy two months after that if you don’t acquire a new source. I have dashboards working at present but still seeking huge nutritional information databases they need to use in their computation of burn rates and requirements. I am seeking to collate all the data I have now into a gigantic SQLite database that runs asynchronously in the background computing all kinds of critical warnings and predictions based on your total inventory and water supplies, for display in dashboards as well as reporting.
My dashboard library is built around FLOTCHARTS, which runs well on Internet Explorer 6! I use ExCanvas to support a lot of functionality all the way back to IE6 that requires “Canvas” displays. The chart library can literally display anything in a flow dashboard that will accommodate any size screen. The dashboard can be configured to show all kinds of heads-up and important reporting for the shelter manager, including real-time data like background radiation trace chart scrolling, etc. Love that library.


